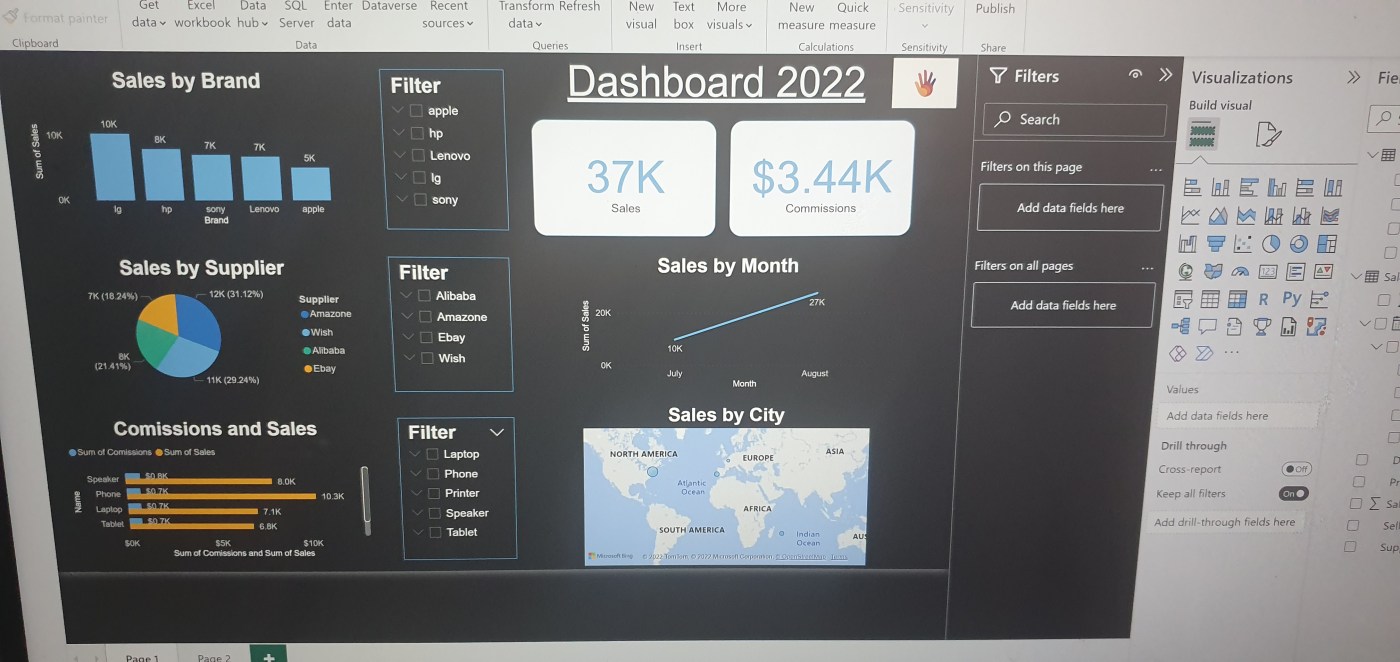
Data visualisation is the graphical representation of information and data using visual elements such as maps, charts and graphs. This enables businesses to identify trends and gain insights from the data. Check out this comprehensive beginner’s guide on FutureLearn. Power BI, Tableau and QlikView are some of the most popular tools used by organisations for Business Analytics.
What is Data Visualisation?